It was a Saturday at dawn. While the sunlight started to color the high standing structures of the feedlot, the first routes of feed trucks started rolling out to visit the hundreds of pens around us. It was breakfast time and the cattle knew it –already unintentionally ‘trained’ by the roar of the engine approaching each pen.
As the truck drove through pen E62’s lane, cattle in the pen increased expectation. One by one, two by two, three by three, and so on, cattle started prowling the front side of the pen. The truck slowly drove by the trough pouring the feed and suddenly the whole length of the trough was filled by cattle eating its morning meal.
Pen design vary a lot, but in this particular feedlot; E62 was 35 x 130 feet and home to 29 cattle. That meant not all of these big fellows could eat at once. That wasn’t such a bad thing for an 850’ish pounds almost-white heifer identified by tag number 1549 that seemed to be the alpha of the pen. It was indeed bad news for a light gray 800’ish pounder heifer identified by tag number 1538 that laid back and carefully walked side to side as if embarrassed tried not to step on anybody’s toes.
CATTLE FEEDING BEHAVIOR
Our nutrition advisors have talked about feeding behavior in cattle for a long time. Alphas are present within every group, and similar to humans, cattle has personality of its own –even to the point that there is bullied cattle. Indeed this seemed difficult to believe. But they know what they’re talking about. Feeding behavior of cattle has been studied for a long time. A search in Google Scholar for +cattle +”eating behavior” (using Google’s notation to account only for articles containing the words “eating behavior” together and forcing the word cattle on the search) rendered +2,100 articles. The oldest dates trace back to 1950 (Tribe, 1950).
Topics within this search vary a lot themselves. Some are related to cows, pigs, sheep, etc. Within cows some are related to dairy and others to beef cattle. Some address pen size, age, phenotypic characteristics, and weather, among many others.
While many of these have addressed the data acquisition process for observations and sampling like we do (i.e. using radio frequency identification technology), we still want to show what we got by ‘watching’ 29 individual cattle living on a pen during 140 days.
WHO’S WHO AT THE TROUGH?
That morning on E62, picking up any trend by eye was hard. Although cattle does have a social hierarchy it is not as if they make a line like going into the movies theatre. It was easy to identify more energetic cattle (e.g. 1549) and shy ones (e.g. 1538); but besides that it was just a bunch of look-alikes crowding the trough. 1549 constantly used its head to bump neighbors into controlling different parts of the feed area although it didn’t need the space. 1538 on the other hand did seemed to be very respectful of others. Pretty much it just stood there until most cattle had eaten to take its turn.
Here’s where the main advantage of using technology as RFID comes in. Those few minutes that Saturday morning and the lack of success of identifying anyone or anything didn’t matter. We had already our ‘eyes’ on all those cattle, 24/7 and monitored their movement in the feeding zone second by second. Talk about a big brother, huh?
DATA COLLECTION
Livestock Analytics uses RFID technology not just for identification purposes, but as a monitoring system for a full trace of cattle in the pen –and specifically in the trough. Second by second, day by day, month by month, we collect information about the presence of cattle on the feeding zone and then build what we call features. Examples of these include total daily presence time by animal, arrival order to the feeding zone, average time per visit per animal to the feeding zone, among many others.
All these features let us make statistical analysis to come up with very interesting knowledge about our cattle –the most basic one perhaps being able to identify morbid animals a lot before than the human eye could. But these applications would be a topic for a different post. For now, let us focus on one particular feature: the arrival order.
So we monitored 1549, 1538 and their 27 ‘roommates’ for 140 days and measured second by second the presence of them in the feeding zone. These particular 29 cattle were charolais heifers received at ~565 lb (256 kg) and slaughtered at ~1,130 lb (512 kg), all purchased from the same breeder. Using different tools and filters we’re able to ‘clean’ the data and then results show up.
THE RESULTS
The following chart shows a summary of the main results. On the horizontal axis we ID each of the 29 heifers in the pen. On the vertical axis we have arrival time to the trough for the early morning meal. Each bar then represents the earliest and latest that every individual arrived to the trough at any point during those 140 days.
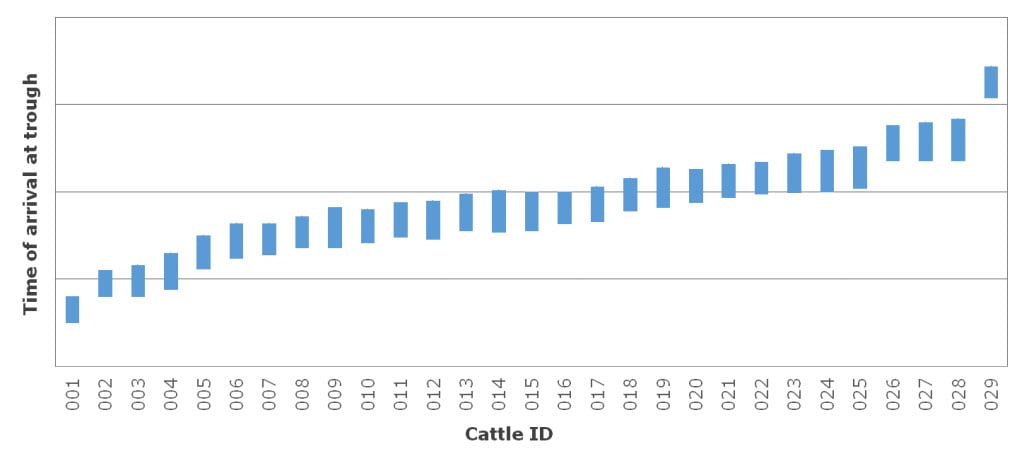
There are several things to point out about this chart. First, it is made of the processing of millions of data from second-by-second observations of cattle within almost half a year. But still, collection and processing is extremely easy using our system. Second, by now you might be able to guess where 1549 is on the chart and also 1538. What seems interesting to us (and perhaps not so much to our ‘told-you-so’ nutrition advisors) is how well defined is the social order in which cattle is arriving to the feeding zone; not one or two, not even a few, but pretty much every day.
The upward pattern once cattle was sorted by arrival time and the ‘separation’ of most cattle’s boxes between the previous top-of-the-bar and its own bottom-of-the-bar suggest an almost-daily same behavior. Indeed, many of the cattle in the middle of the chart are very similar but still can mark a trend.
CONCLUSIONS
Although these results are interesting themselves, the true challenge comes from correlating them with actual decision-making information e.g. identifying morbid cattle. Many other experiments must be ran and modeling tested, but the intelligent mining of data is where actual value for feedlots is. This is part of Livestock Analytics’ goal, to be able to provide timely recommendations to the people who need them when they need them; and specially, doing so while not having to invest $100 grand per pen in expensive hardware.